PIZZA PIZZA ROYALTY CORP. ANNOUNCES STRONG FOURTH QUARTER and FULL YEAR RESULTS and a 3.6% DIVIDEND INCREASE


Pizza Pizza Royalty Corp. (the "Company") (TSX: PZA), which indirectly owns the Pizza Pizza and Pizza 73 Rights and Marks, released financial results for the three months ("Quarter") and twelve months ("Year") ended December 31, 2022.
Fourth Quarter highlights:
- Same store sales increased 13.0%
- Royalty Pool sales increased 11.2%
- Adjusted earnings per share(5) increased 11.1%
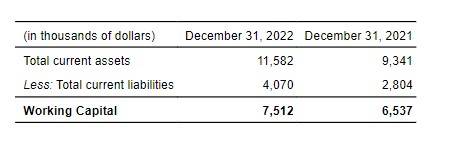
- Working capital(5) reserve increased $0.5 million during the quarter to $7.5 million at December 31, 2022
- Payout ratio(5) was 91%
- 18 new restaurants opened
- Monthly cash dividend increased 3.7% effective November
Year-to-Date highlights:
- Same store sales increased 15.2%
- Royalty Pool sales increased 15.1%
- Adjusted earnings per share(5) increased 14.3%
- Working capital(5) increased $1.0 million
- Payout ratio(5) was 95%
- 45 new restaurants opened
- Monthly cash dividend increased 16.7% in 2022
Paul Goddard, CEO, Pizza Pizza Limited ("PPL") said, "Our sales increased by double-digits during the year while we also opened a record 45 new restaurants. Our restaurants managed through inflationary pressures from both commodity and labour increases. The positive momentum throughout 2022 allowed for three dividend increases as walk-in and pickup sales increased significantly as pandemic restrictions were relaxed or removed, and we are pleased to announce another dividend increase surpassing our pre-Covid dividend rate. We look to continue the sales momentum by leveraging our marketing strengths while featuring our high quality menu offerings."
SALES
For the three months ended December 31, 2022, System Sales from the 727 restaurants in the Royalty Pool increased 11.2% to $153.2 million from $137.7 million in the same quarter last year when there were 725 restaurants in the Royalty Pool. By brand, sales from the 624 Pizza Pizza restaurants in the Royalty Pool increased 13.2% to $132.1 million for the Quarter compared to $116.7 million in the same quarter last year. Sales from the 103 Pizza 73 restaurants increased 0.4% to $21.1 million for the Quarter compared to $21.0 million in the same quarter last year.
For the twelve months ended December 31, 2022, Royalty Pool System Sales for the Year increased 15.1% to $568.3 million from $493.6 million in the same period last year. By brand for the Year, sales from the 624 Pizza Pizza restaurants in the Royalty Pool increased 17.7% to $490.6 million compared to $416.9 million in the prior year. Sales from the 103 Pizza 73 restaurants increased 1.2% to $77.7 million compared to $76.7 million in 2021.
For the Quarter and Year, the increase in Royalty Pool System Sales is primarily driven by the increase in same store sales and the full re-opening of the economy and many non-traditional locations reopening as the Year progressed. Additionally, while the number of restaurants in the Royalty Pool increased in 2022, it remains less than 2019 when there were 772 restaurants in the Royalty Pool. The negative impact on Royalty Pool System Sales due to prior year restaurant closures has been mitigated by the Make-Whole Carryover Amount.
SAME STORE SALES GROWTH ("SSSG")
SSSG, the key driver of yield growth for shareholders of the Company, increased 13.0% (2021 –12.4%) for the Quarter and 15.2% (2021 –0.5%) for the Year.
|
SSSG |
Fourth Quarter (%) |
Year (%) |
||
|
2022 |
2021 |
2022 |
2021 |
|
|
Pizza Pizza |
15.2 |
13.9 |
17.8 |
2.1 |
|
Pizza 73 |
1.3 |
5.0 |
1.1 |
-7.1 |
|
Combined |
13.0 |
12.4 |
15.2 |
0.5 |
SSSG is driven by the change in the customer check and customer traffic, both of which are affected by changes in pricing and sales mix. During the Quarter and Year, the average customer check increased as the brands successfully passed along retail price increases largely related to commodity and labour increases. At Pizza Pizza, for the Quarter and Year, the increase in SSSG was driven by consumers significantly increasing restaurant visits compared to the prior year partially due to the lifting of COVID-19 related public health restrictions. Sales also benefitted from value messages and promotional brand activities, plus the reopening of non-traditional locations as well as students returning to in-person classes. At Pizza 73, which depends heavily on pizza delivery versus in-store visits, the SSSG was adversely affected by customers preparing more meals at home plus competition from third party food delivery apps resulting in a decline in overall customer orders.
MONTHLY DIVIDEND AND WORKING CAPITAL RESERVE
Subsequent to the quarter end, with the reported strong SSSG and working capital, the Board of Directors approved a 3.6% increase in the monthly dividend, from $0.07 to $0.0725 per share, effective March 2023. The dividend will be payable to shareholders of record at the close of business on March 31, 2023 and will be paid on April 14, 2023.
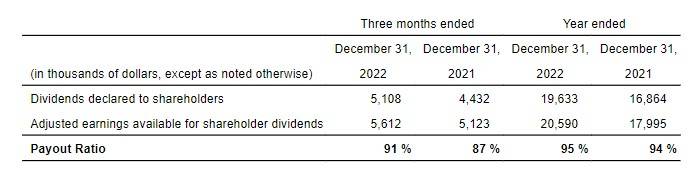
The Company declared shareholder dividends of $5.1 million for the Quarter, or $0.2075 per share, compared to $4.4 million, or $0.180 per share, for the prior year comparable quarter. The payout ratio is 91% for the Quarter and was 87% in the prior year, comparable quarter.
The Company declared shareholder dividends of $19.6 million for the Year, or $0.7975 per share, compared to $16.9 million, or $0.685 per share, for the prior year comparable period. The payout ratio is 95% for 2022 and was 94% in 2021.
The Company's policy is to distribute all available cash in order to maximize returns to shareholders over time, after allowing for reasonable reserves. Despite seasonal variants inherent to the restaurant industry, the Company's policy is to make equal dividend payments to shareholders on a monthly basis in order to smooth out income to shareholders.
The Company's working capital reserve is $7.5 million at December 31, 2022, which is an increase of $0.5 million in the Quarter due to the 91% payout ratio. With the increase in the monthly dividend in February, June and November 2022 and March 2023, the Company believes that there is sufficient cash flow to service the Company's obligations as they fall due, while also increasing the monthly dividend above its pre-COVID levels.
The reserve is available to stabilize dividends and fund other expenditures in the event of short- to medium-term variability in System Sales and, thus, the Company's royalty income. The Company has historically targeted a payout ratio at or near 100% on an annualized basis. See "Dividends".
CREDIT FACILITY
On June 28, 2019, the Partnership amended and extended its $47 million credit facility with a syndicate of chartered banks from April 2020 to April 2025. The credit facility bears interest at the Canadian Bankers' Acceptance rate plus a credit spread between 0.875% to 1.375%, depending on the level of debt-to-earnings before interest, taxes, depreciation and amortization ("EBITDA"), with EBITDA defined as annualized earnings before interest, taxes, depreciation and amortization.
In April 2020 the facility interest was at an effective interest rate of 2.685% comprised of a fixed rate of 1.81% plus a credit spread of 0.875% through to March 31, 2021. In April 2021, the credit spread increased to 1.125% pursuant to the table described below, raising the combined interest rate to 2.935%. In April 2022, the credit spread decreased as the impact of COVID-19 lessened and earnings improved, the effective interest rate decreased to 2.685%.
CURRENT INCOME TAX EXPENSE
Current income tax expense for the Quarter increased to $1.7 million from $1.5 million. For the Year, current income tax increased to $6.1 million from $5.2 million. The increase for the Quarter and Year are a result of the increase in the Company's earnings before income taxes.
EARNINGS PER SHARE ("EPS")
Fully-diluted basic EPS increased 15.3% to $0.2075 for the Quarter compared to the prior year comparable quarter, and increased 16.4% to $0.7975 for the year.
As compared to basic EPS, the Company considers Adjusted EPS(5) to be a more meaningful indicator of the Company's operating performance and, therefore, presents fully-diluted, adjusted EPS. Adjusted EPS for the Quarter increased 11.2% to $0.238 when compared to the same period in 2021, and increased 14.4% to $0.883 for the year.
RESTAURANT DEVELOPMENT
As announced earlier this year, the number of restaurants in the Company's Royalty Pool increased by two locations to 727 on the January 1, 2022 Adjustment Date, and consists of 624 Pizza Pizza restaurants and 103 Pizza 73 restaurants. The number of restaurants in the Royalty Pool will remain unchanged through December 31, 2022.
During the Quarter, PPL opened 10 traditional Pizza Pizza restaurants, including four openings in British Columbia, three in Nova Scotia, two in Quebec and one in New Brunswick, and opened eight non-traditional Pizza Pizza restaurants. PPL closed one traditional and two non-traditional Pizza Pizza restaurants. At the Pizza 73 brand, PPL had no openings and closed one non-traditional restaurant.
During the Year, PPL opened 24 traditional and 19 non-traditional Pizza Pizza restaurants, and closed eight traditional and 16 non-traditional restaurants, the majority of which were smaller movie theatre venues. Additionally, at the Pizza 73 brand, PPL opened one traditional and one non-traditional restaurant, closed four non-traditional restaurants, and converted two Pizza 73 traditional restaurants into Pizza Pizza restaurants.
New restaurant construction continues across Canada as PPL executes on its national expansion plan. PPL management expects to grow its traditional network by 3 to 4% in 2023; its franchisee pipeline remains strong and its renovation program will continues through 2023.
Readers should note that the number of restaurants added to the Royalty Pool each year may differ from the number of restaurant openings and closings reported by PPL on an annual basis as the periods for which they are reported differ slightly.
SELECTED FINANCIAL HIGHLIGHTS
The following tables set out selected financial information and other data of Pizza Pizza Royalty Corp. ("PPRC" or the "Company") and should be read in conjunction with the December 31, 2022 audited consolidated financial statements of the Company ("Financial Statements"). Readers should note that the 2022 results are not directly comparable to the 2021 results due to there being 727 restaurants in the 2022 Royalty Pool compared to 725 restaurants in the 2021 Royalty Pool.
|
(in thousands of dollars, except number of |
Three months |
Three months |
Year ended December 31, |
Year ended December 31, |
|
|
Restaurants in Royalty Pool(1) |
727 |
725 |
727 |
725 |
|
|
Same store sales growth(2) |
13.0 % |
12.4 % |
15.2 % |
0.5 % |
|
|
Days in the Period |
92 |
92 |
365 |
365 |
|
|
System Sales reported by Pizza Pizza restaurants in the Royalty Pool(6) |
$ 132,108 |
$ 116,729 |
$ 490,626 |
$ 416,904 |
|
|
System Sales reported by Pizza 73 restaurants in the Royalty Pool(6) |
21,077 |
20,997 |
77,656 |
76,718 |
|
|
Total System Sales |
$ 153,185 |
$ 137,726 |
$ 568,282 |
$ 493,622 |
|
|
Royalty – 6% on Pizza Pizza System Sales |
$ 7,926 |
$ 7,004 |
$ 29,438 |
$ 25,014 |
|
|
Royalty – 9% on Pizza 73 System Sales |
1,898 |
1,890 |
6,989 |
6,905 |
|
|
Royalty income |
$ 9,824 |
$ 8,894 |
$ 36,427 |
$ 31,919 |
|
|
Interest paid on borrowings(3) (5) |
(323) |
(350) |
(1,322) |
(1,355) |
|
|
Administrative expenses |
(233) |
(179) |
(632) |
(559) |
|
|
Interest Income |
82 |
- |
82 |
- |
|
|
Adjusted earnings available for distribution to the Company and Pizza Pizza Limited(5) |
$ 9,350 |
$ 8,365 |
$ 34,555 |
$ 30,005 |
|
|
Distribution on Class B and Class D Exchangeable Shares(4) |
(2,059) |
(1,779) |
(7,823) |
(6,856) |
|
|
Current income tax expense |
(1,679) |
(1,463) |
(6,142) |
(5,154) |
|
|
Adjusted earnings available for shareholder dividends(5) |
$ 5,612 |
$ 5,123 |
$ 20,590 |
$ 17,995 |
|
|
Add back: |
|||||
|
Distribution on Class B and Class D Exchangeable Shares(4) |
2,059 |
1,779 |
7,823 |
6,856 |
|
|
Adjusted earnings from operations(5) |
7,671 |
$ 6,902 |
$ 28,413 |
$ 24,851 |
|
|
Adjusted earnings per share(5) |
$ 0.238 |
$ 0.214 |
$ 0.883 |
$ 0.772 |
|
|
Basic earnings per share |
$ 0.232 |
$ 0.207 |
$ 0.856 |
$ 0.743 |
|
|
Dividends declared by the Company |
$ 5,108 |
$ 4,431 |
$ 19,633 |
$ 16,864 |
|
|
Dividend per share |
$ 0.2075 |
$ 0.180 |
$ 0.7975 |
$ 0.685 |
|
|
Payout ratio(5) |
91 % |
87 % |
95 % |
94 % |
|
|
December 31, 2022 |
December 31, 2021 |
||||
|
Working capital(5) |
$ 7,512 |
$ 6,537 |
|||
|
Total assets |
$ 367,831 |
$ 363,057 |
|||
|
Total liabilities |
$ 75,408 |
$ 72,831 |
|||
|
(1) |
The number of restaurants for which the Pizza Pizza Royalty Limited Partnership (the "Partnership") earns a royalty ("Royalty Pool"), as defined in the amended and restated Pizza Pizza license and royalty agreement (the "Pizza Pizza License and Royalty Agreement") and the amended and restated Pizza 73 license and royalty agreement (the "Pizza 73 License and Royalty Agreement") (together, the "License and Royalty Agreements"). For the 2022 fiscal year, the Royalty Pool includes 624 Pizza Pizza restaurants and 103 Pizza 73 restaurants. The number of restaurants added to the Royalty Pool each year may differ from the number of restaurant openings and closings reported by Pizza Pizza Limited ("PPL") on an annual basis as the periods for which they are reported differ slightly. |
|
(2) |
Same store sales growth ("SSSG") is a supplementary financial measure under NI 52-112 and therefore may not be comparable to similar measures presented by other issuers. SSSG means the change in reporting period's gross revenue of a particular Pizza Pizza or Pizza 73 restaurant as compared to sales in the previous comparative year, where the restaurant has been open at least 13 months. Additionally, for a Pizza 73 restaurant whose restaurant territory was adjusted due to an additional restaurant, the sales used to derive the Step-Out Payment (calculated as the difference between the average monthly Pizza 73 Royalty payment attributable to that Adjusted Restaurant in the 12 months immediately preceding the month in which the territory reduction occurs, less the Pizza 73 Royalty payment attributable to the restaurant in the current month) may be added to sales to arrive at SSSG. SSSG does not have any standardized meaning under International Financial Reporting Standards ("IFRS"). See "Exhibit One: Reconciliation of Non-IFRS Measures". |
|
(3) |
The Company, indirectly through the Partnership, incurs interest expense on the $47 million outstanding bank loan. Interest expense also includes amortization of loan fees. . |
|
(4) |
Represents the distribution to PPL from the Partnership on Class B and Class D Units of the Partnership. The Class B and D Units are exchangeable into common shares of the Company ("Shares") based on the value of the Class B Exchange Multiplier and the Class D Exchange Multiplier at the time of exchange as defined in the License and Royalty Agreements, respectively, and represent 23.5% of the fully diluted Shares at December 31, 2022 (December 31, 2021 – 23.5%). During the quarter ended March 31, 2022, as a result of the final calculation of the equivalent Class B and Class D Share entitlements related to the January 1, 2021 Adjustment to the Royalty Pool, PPL was not paid a distribution on additional equivalent Shares as if such Shares were outstanding as of January 1, 2021. Included in the three months ended March 31, 2022, is the payment of $nil in distributions to PPL pursuant to the true-up calculation (March 31, 2021 - PPL received $nil). |
|
(5) |
"Adjusted earnings available for distribution to the Company and Pizza Pizza Limited", "Adjusted earnings from operations", "Adjusted earnings available for shareholder dividends", "Adjusted earnings per Share", "Interest paid on borrowings", "Payout Ratio", and "Working Capital" are non-GAAP financial measures under NI 52-112. They do not have any standardized meaning under IFRS and therefore may not be comparable to similar measures presented by other issuers. See "Exhibit One: Reconciliation of Non-IFRS Measures". |
|
(6) |
System Sales (as defined in the License and Royalty Agreements) reported by Pizza Pizza and Pizza 73 restaurants include the gross sales of Pizza Pizza company-owned, jointly-controlled and franchised restaurants, and the monthly Make-Whole Payment, excluding sales and goods and service tax or similar amounts levied by any governmental or administrative authority. System Sales do not represent the consolidated operating results of the Company but are used to calculate the royalties payable to the Partnership as presented above. |
A copy of the Company's audited annual consolidated financial statements and related Management's Discussion and Analysis ("MD&A") will be available at www.sedar.com and www.pizzapizza.ca after the market closes on March 7, 2023.
As previously announced, the Company will host a conference call to discuss the results. The details of the conference call are as follows:
A recording of the call will also be available on the Company's website at www.pizzapizza.ca.
FORWARD-LOOKING STATEMENTS
Certain statements in this report, including information regarding the Company's dividend policy, its ability to meet covenants and other financial obligations, and the potential business and financial impacts of the COVID-19 pandemic on the Company, PPL and its franchisees and restaurant operators and their ability to achieve their business objectives, constitute "forward-looking" statements, which involve known and unknown risks, uncertainties and other factors that may cause the actual results, performance or achievements to be materially different from any future results, performance or achievements expressed or implied by such forward-looking statements. When used in this report, such statements include such words as "may", "will", "expect", "believe", "plan", and other similar terminology in conjunction with a discussion of future events or operating or financial performance. These statements reflect management's current expectations regarding future events and operating and financial performance and speak only as of the date of this MD&A. The Company does not intend to or assume any obligation to update any such forward looking statements, whether as a result of new information, future events or otherwise, except as required by applicable securities laws. These forward-looking statements involve a number of risks and uncertainties. The following are some factors that could cause actual results to differ materially from those expressed in or underlying such forward-looking statements: changes in national and local business and economic conditions including those resulting from the COVID-19 pandemic (such as restrictions on restaurant operations, customers' ability and willingness to visit restaurants and their perception of health and food safety issues, discretionary spending patterns and supply chain limitations, and the related financial impact on PPL and its franchisees and restaurant operators and their ability to meet debt and lease obligations), impacts of legislation and governmental regulation, accounting policies and practices, competition, changes in demographic trends and changing consumer preferences, and the results of operations and financial condition of PPL. The foregoing list of factors is not exhaustive and should be read in conjunction with the other information included in the foregoing MD&A, the PPL financial statements for the period ended January 1, 2023 and the related MD&A and the Company's Annual Information Form.
www.pizzapizza.ca and www.pizza73.com or www.sedar.com.
Exhibit One: Reconciliation of Non-IFRS Measures
The Company's earnings, as presented under IFRS includes non-cash items, such as deferred tax, that do not affect the Company's business operations or its ability to pay dividends to shareholders. The Company believes its earnings are not the only, or most meaningful, measurement of the Company's ability to pay dividends or measure the rate at which the Company is paying out its earnings. Therefore, the Company reports the following non-IFRS measures:
- Adjusted earnings available for distribution to the Company and PPL;
- Adjusted earnings from operations;
- Adjusted earnings available for shareholder dividends;
- Adjusted earnings per share ("EPS");
- Payout Ratio; and
- Working Capital.
The Company believes that the above noted measures provide investors with more meaningful information regarding the amount of cash that the Company has generated to pay dividends, and, together with Interest Paid on Borrowings and SSSG, help illustrate the Company's operating performance and highlight trends in the Company's business. These measures are also frequently used by analysts, investors, and other interested parties in the evaluation of issuers in the Company's sector, particularly those with a royalty-based model. The adjustments to net earnings as recorded under IFRS relate to non-cash items included in earnings and cash payments accounted for on the statement of financial position. Investors are cautioned, however, that this should not be construed as an alternative to net earnings as a measure of profitability. The method of calculating the Company's NI 52-112 non-GAAP financial measures: Adjusted earnings available for distribution to the Company and Pizza Pizza Limited, Adjusted earnings from operations, Adjusted earnings available for shareholder dividends, Adjusted EPS, Payout Ratio, Working Capital, Interest Paid on Borrowings and SSSG for the purposes of this MD&A may differ from that used by other issuers and, accordingly, these measures may not be comparable to similar measures used by other issuers.
The table below reconciles the following to "Earnings for the period before income taxes" which is the most directly comparable measure calculated in accordance with IFRS:
- Adjusted earnings available for distribution to the Company and Pizza Pizza Limited;
- Adjusted earnings from operations; and
- Adjusted earnings available for shareholder dividends.

The Basic EPS and the Adjusted EPS calculations are based on fully diluted weighted average shares, and both include PPL's Class B and Class D Exchangeable Shares since they are exchangeable into and economically equivalent to the Shares. See "Adjusted EPS".
Adjusted EPS is calculated by dividing Adjusted earnings from operations, as explained above, by the fully diluted weighted average shares.
Basic EPS is adjusted as follows:
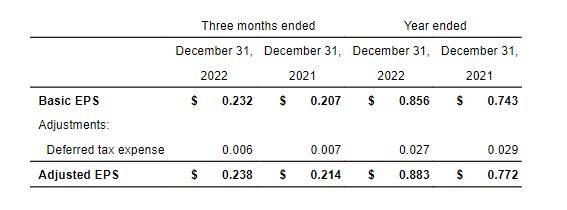
Payout Ratio is a non-IFRS financial measure that does not have a standardized meaning prescribed by IFRS and therefore may not be comparable to similar measures presented by other issuers. The Company presents the Payout Ratio to illustrate the earnings being returned to shareholders. The Company's Payout Ratio is calculated by dividing the dividends declared to shareholders by the adjusted earnings from operations, after paying the distribution on Class B and Class D Exchangeable Shares, in that same period.
Working Capital is defined as total current assets less total current liabilities. The Company views working capital as a measure for assessing overall liquidity and its ability to stabilize dividends and fund unusual expenditures in the event of short- to medium-term variability in Royalty Pool System Sales.
For further information: Christine D'Sylva, Chief Financial Officer, Pizza Pizza Royalty Corp., (416) 967-1010 x393 cdsylva@pizzapizza.ca; Alexander Sewrattan, Director of Finance, Pizza Pizza Limited, (416) 967-1010 x415 asewrattan@pizzapizza.ca